Strava statistics all-time
Published:
The Strava wrapped you’ve always wanted
Strava wrapped: Provo Edition
Every year Strava does a “Year in Review”, akin to Spotify wrapped. They summarize the year through total distance, days worked out, and other fun metrics. I’ve always wanted to get my hands on the data and calculate some other fun numbers.
The data
I downloaded all the data from my Strava account, which contained 584 activities across 6.5 years (from about August 2018 to March 2025). For each activity, there are many data fields, though I selected the most substantive ones like distance, type of activity, date. You can even get the gpx file of each activity and plot the route (more on that later). After I cleaned up the data, I got to graphing, one of my favorite past-times. Though I hope to spend more time digesting these results, it was fun to at least get a few figures cranked out. Let’s dig in.
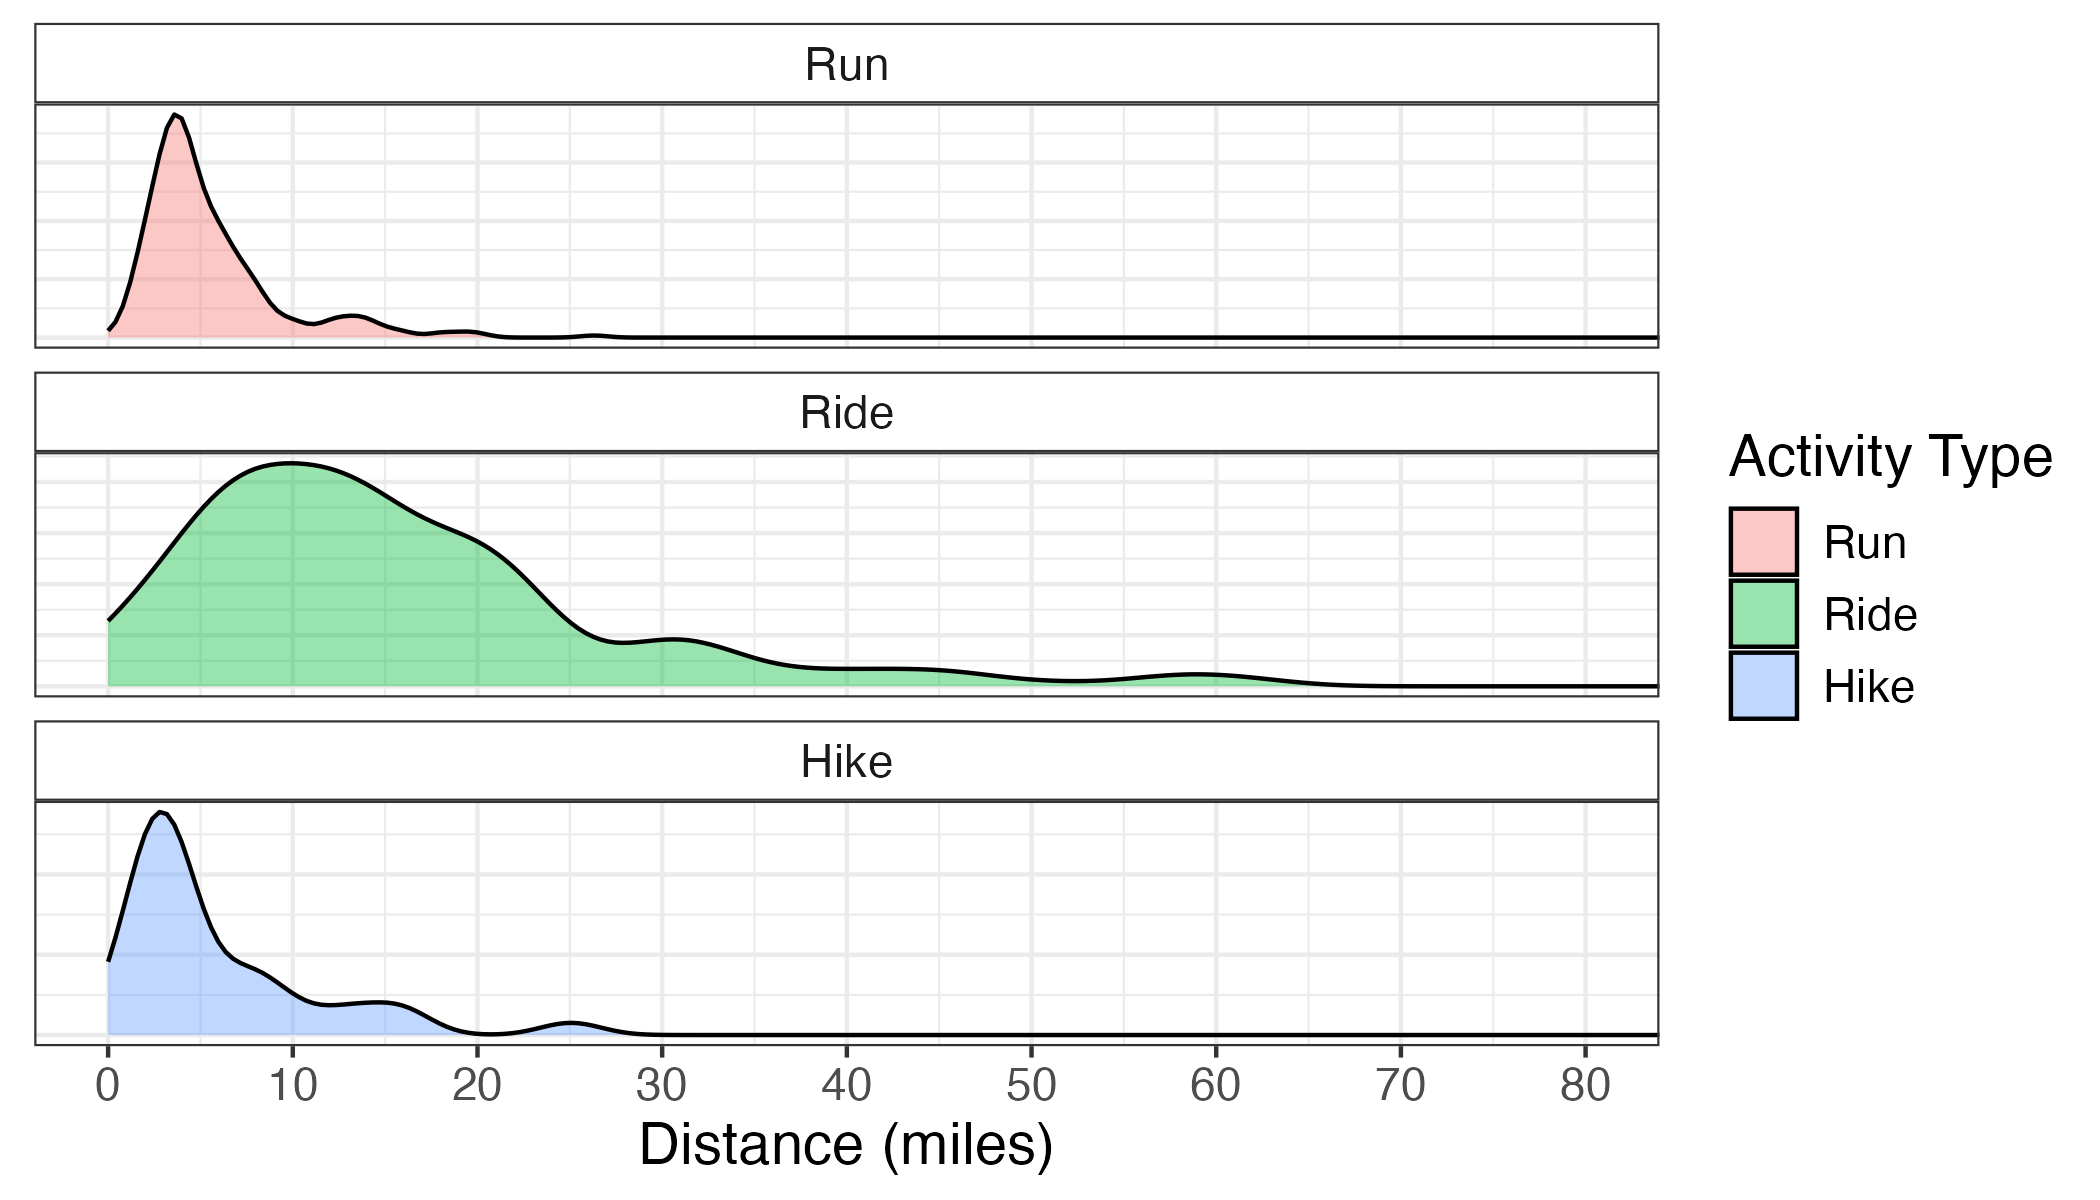
Of course, first in the lineup is a distribution plot across time. I’ve limited the density plots to runs, rides, and hikes as they were the most common. I’ve cropped the axis lower than the max distance for easier viewing. It’s interesting that runs and hikes have a mored “peaked” distribution while rides are more spread, or that I I’ve done a greater variety of biking distances as compared to runs or hikes.
Below is a high-level breakdown of all-time statistics, including the median distance, maximum distance, total elevation gain, and total moving time. I report the median as a measure of centrality as the distribution is skewed to to the right. I merged one e-bike ride into the “Ride” category and merged any ski activities (e.g. backcountry skiing, downhill skiing) into one category.
| Activity Type | Count | Total Distance in miles (km) | Median Distance in miles (km) | Max Distance in miles (km) | Total Elevation Gain in feet (meters) | Total Moving Time in hours |
|---|---|---|---|---|---|---|
| Run | 300 | 1,655.8 (2,665) | 4.3 ( 6.9) | 26.3 ( 42.3) | 59,192 (18,042) | 221.7 |
| Ride | 241 | 4,160.1 (6,695) | 13.5 (21.7) | 203.4 (327.4) | 211,053 (64,329) | 286.7 |
| Hike | 32 | 190.2 ( 306) | 3.6 ( 5.8) | 25.1 ( 40.3) | 51,863 (15,808) | 87.5 |
| Swim | 8 | 7.4 ( 12) | 1.1 ( 1.7) | 1.3 ( 2.0) | 0 ( 0) | 3.9 |
| Ski | 3 | 7.2 ( 12) | 2.6 ( 4.1) | 2.6 ( 4.2) | 1,209 ( 368) | 2.4 |
| All Types | 584 | 6,020.7 (9,689) | 6.2 (10.0) | 203.4 (327.4) | 323,317 (98,547) | 602.1 |
Some fun and interesting observations from the table:
- I’ve done the most running activities, followed by rides and hikes. This is surprising to me, as I would say I generally enjoy biking more than running.
- My bike rides had more climbing in them than runs. The average (elevation gain only) gradient across all runs was
59192 / 5280 / 1656 * 100 = 0.677%while the average gradient across all rides was211053 / 5280 / 4160 * 100 = 0.961%. Unsurprisingly, the average uphill-only gradient was highest for hikes (among my three highest-volume sports) at15808 / 1000 / 306 * 100 = 5.166%. - I’ve spent
602.1 / 24 = 25.1straight days doing a recorded workout. More practically, I’ve averaged602.1 / 6.5 / 52 = 1.78hours a week working out. - It’s about 6,511.53 miles to drive from Paris to Beijing. If I put all my miles together, I’d only be 500 miles shy of such a legendary trek.
- Many people use a 3:1 conversion to compare cycling miles to running miles (e.g. 3 miles cycling is roughly equivalent to 1 mile running). This website makes the conversion using calories and reports a 3.5:1 ratio when biking at 15 mph. The ratio from my median bike ride (13.5 miles) and median run (4.3 miles) is pretty close to that, which suggests a fairly balanced distribution of runs and rides. In other words, my typical (or median) ride was comparable in effort to my typical run in the last 6 years.
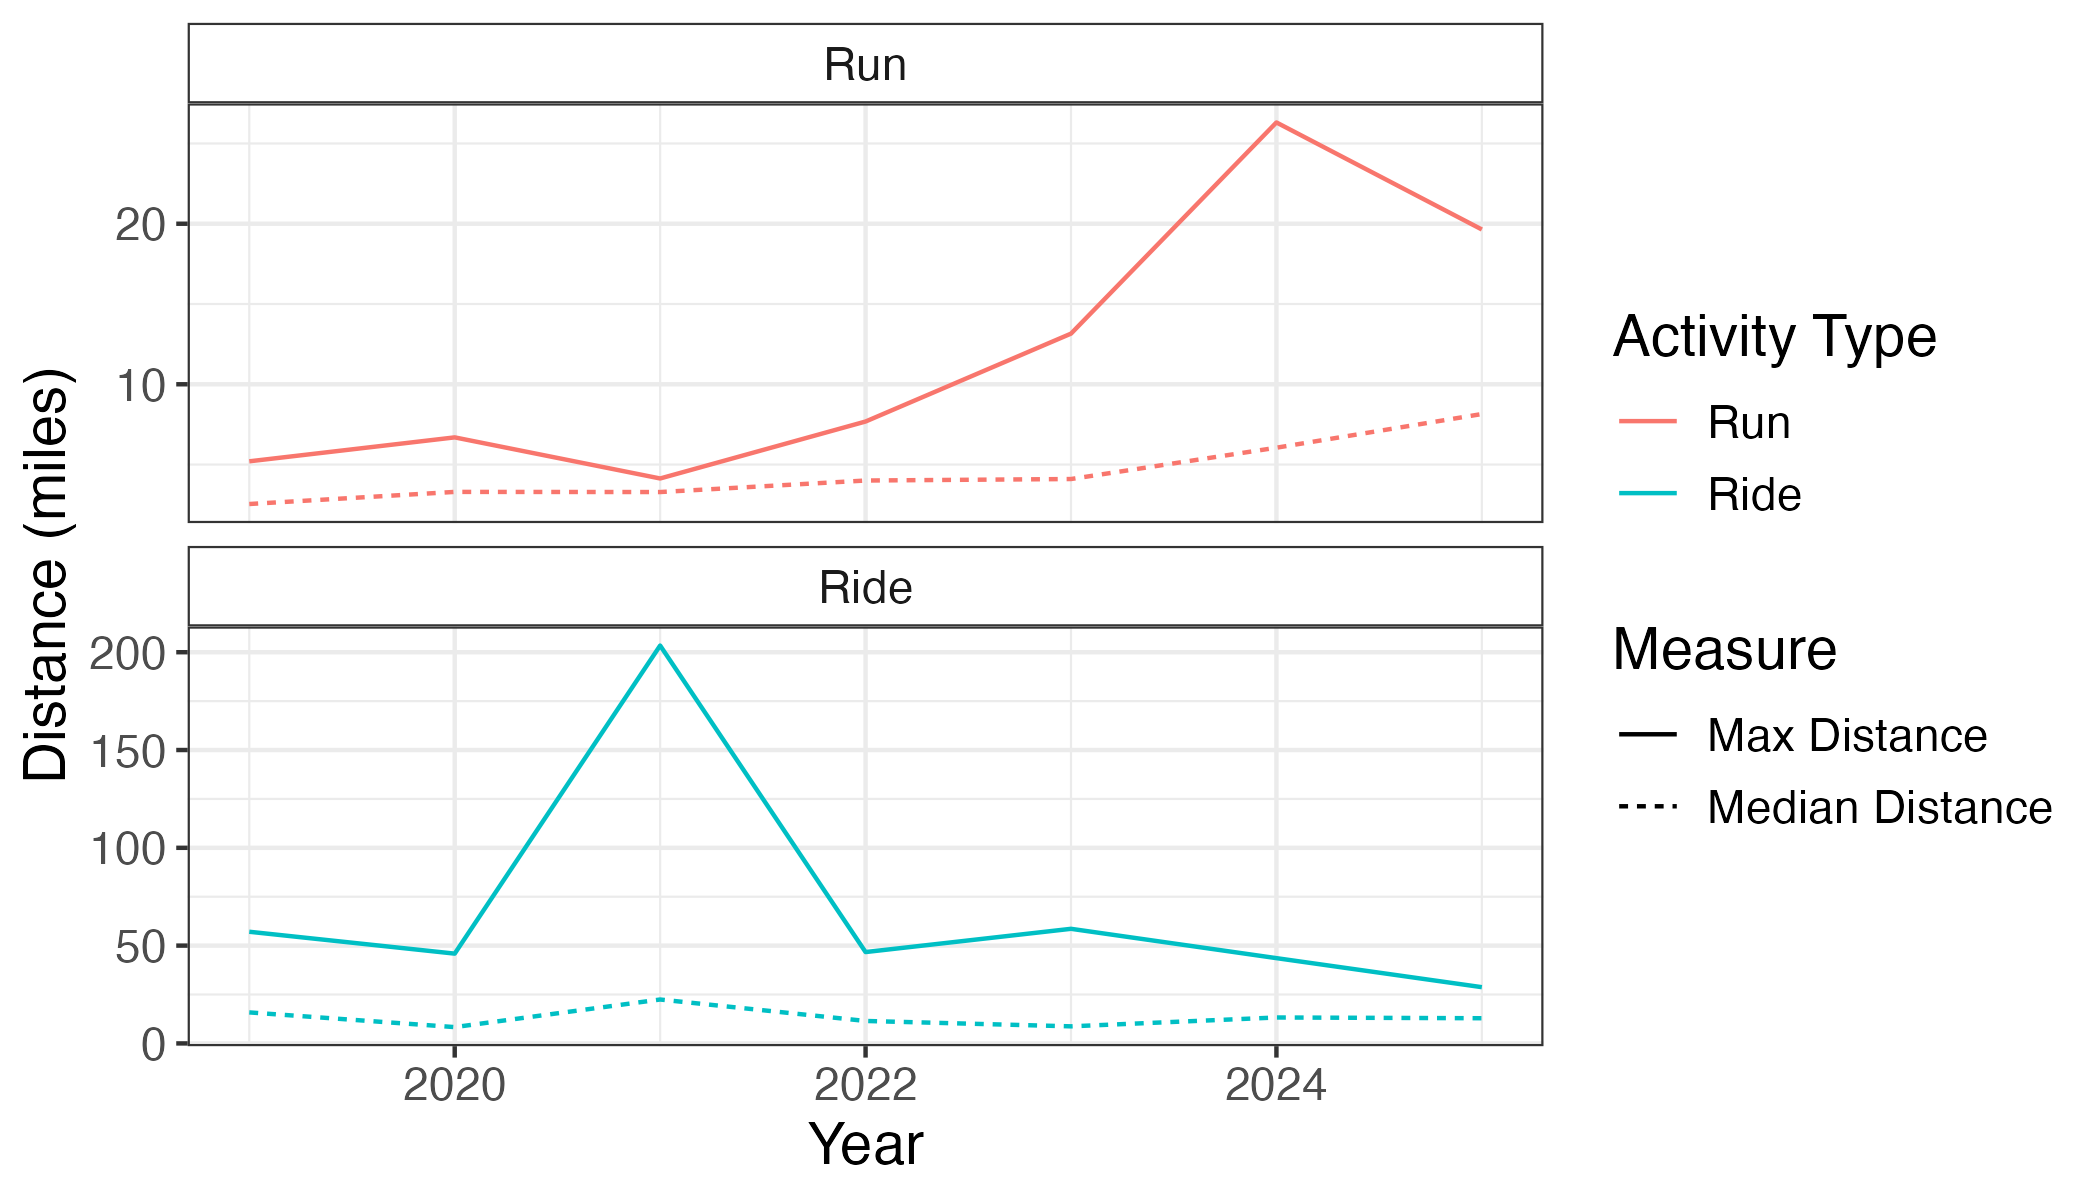
Below is a figure that shows the median and maximum distance by year for bike rides and runs. You can spot the year that I trained for and completed LOTOJA (2021) and which year I ran my first marathon (2024). I would say that I enjoy biking more than running, which I believe is apparent that the max distance in years not-training for a bike event were still around 50 miles. I guess you could consider it my annual bike ride where I was way over my head, but still wanted to get out on the saddle.
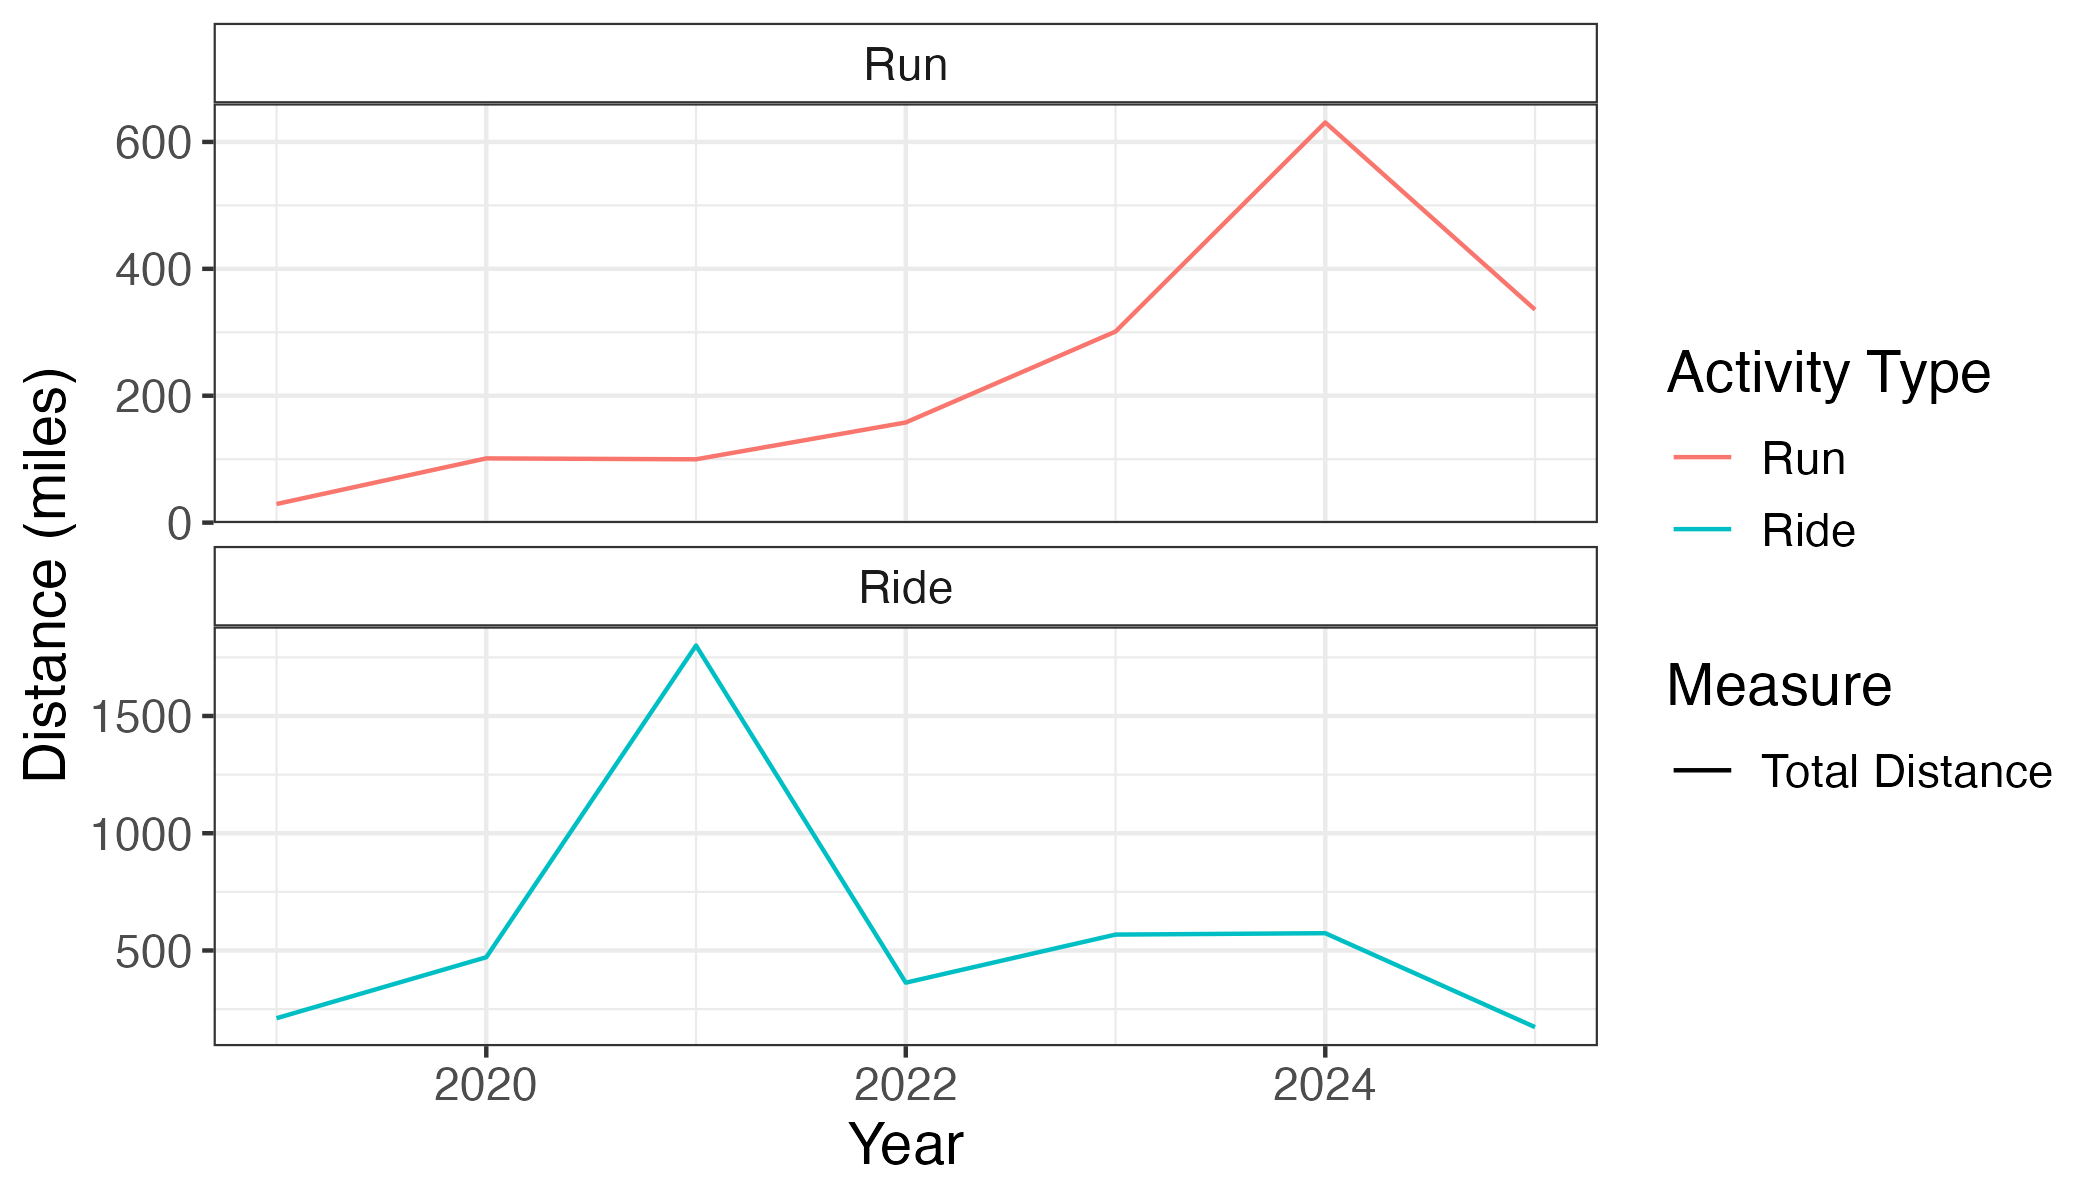
Below are the total distances by year and activity type. I’ve maintained a modest amount of running that has seen a serious uptick in the last few years. In fact, the amount of running I’ve done in 2025 has already surpassed the running I did each year from 2019-2023 (and I ran a half-marathon in 2023). That’s not altogether too surprising as I’m in a current marathon training cycle and will run a marathon this weekend.
Heatmap
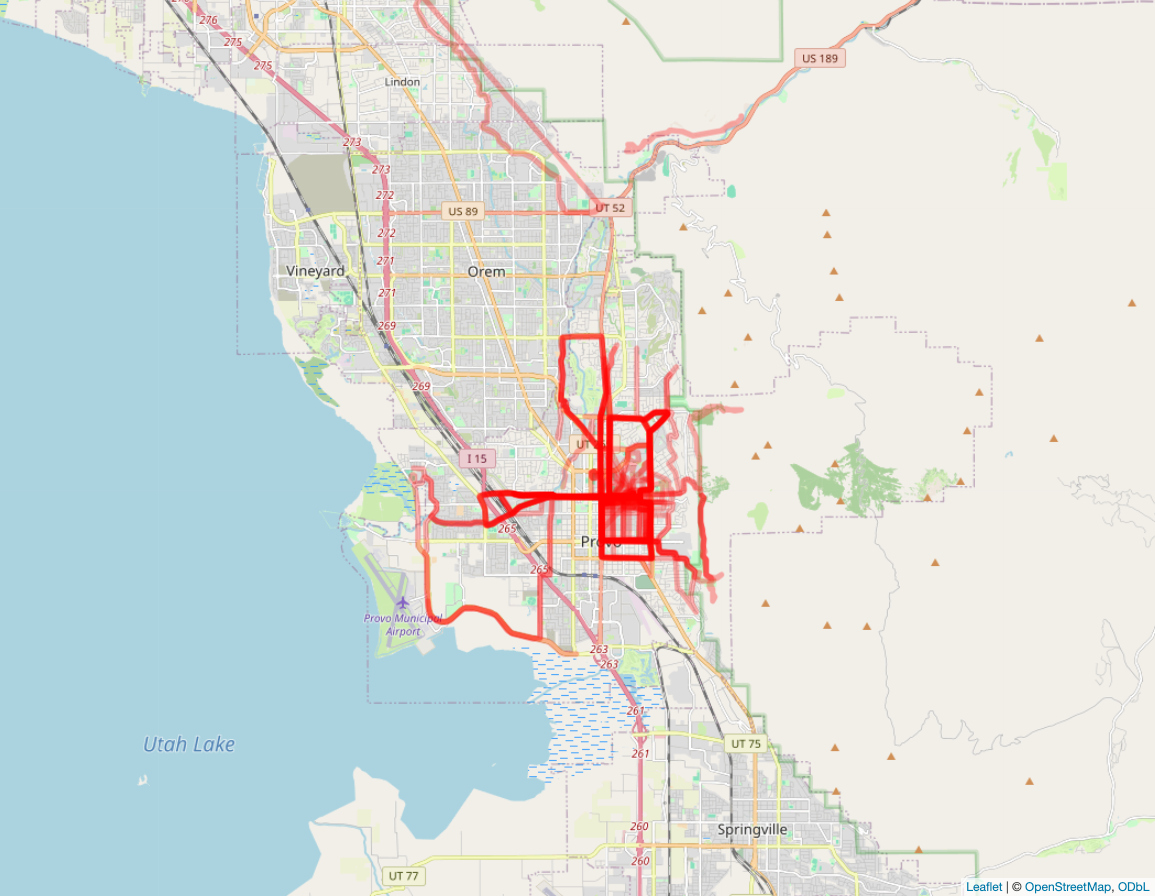
I took the GPS files (either a .fit or .gpx file) and plotted them all on a map using the leaflet package in R. As nearly all of the activities originate in Provo, the images are taken of UT county and Provo. I reduced the “boldness” of each ride, so frequently used routes would be highlighted. The snapshots start at UT county and zoom in to Provo.
Bike rides
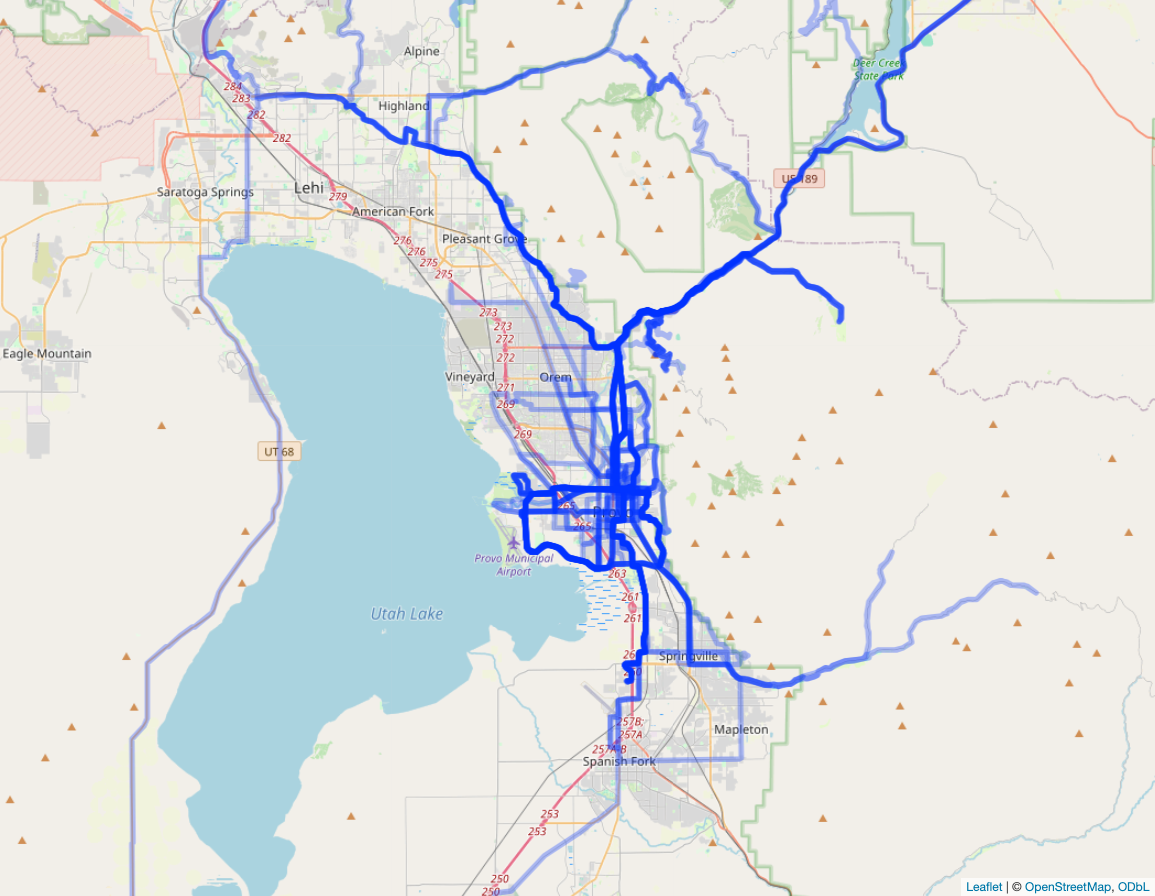
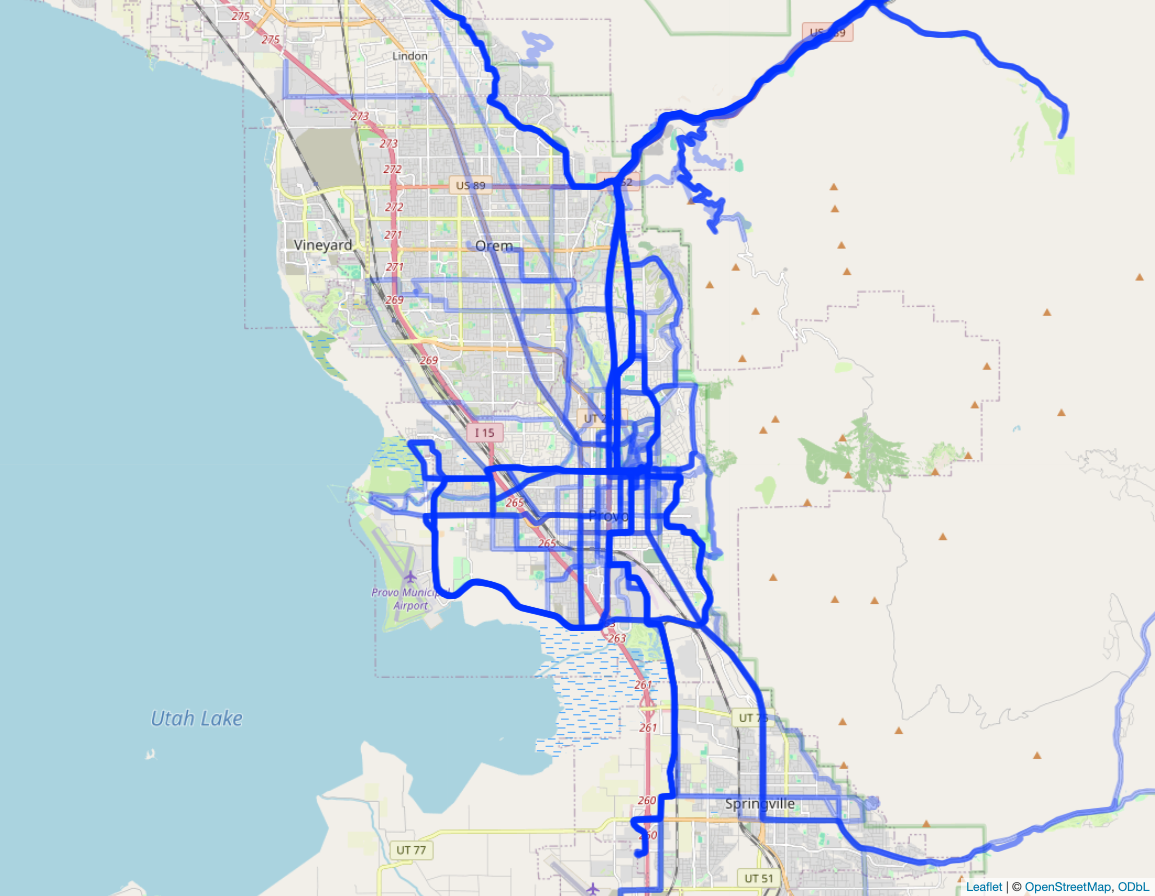
Some noticeable routes are the Provo Canyon, South Fork Canyon up past Vivian Park, Bonneville Shoreline Trail, Lakeview Parkway (that goes past the airport), and Slate Canyon Drive on the East side of Provo. The main cycling event I trained for (LOTOJA) had several climbs, and I’d like to say I didn’t steer away from climbs while training.
One of my favorite routes was to Provo canyon and then up to South Fork. It was the perfect blend of training and quickly gettting outside for the scenery. It was about 5 miles to the mouth of the canyon from my apartment, then 5 miles to where the bike path and road meets back up with the highway (then 4 miles and change to the top of South Fork if you were feeling it). A real treat was to do this ride towards the end of the evening. I have the sweetest memories of finishing the climb up the Provo River Scenic Drive, turning around where it meets the highway, and admiring the stunning, sunset-splashed rock and trees around Bridal Veil Falls as I chased the sun out of the canyon. If I had a chance to do one more hour-long ride in Provo, that might be it.
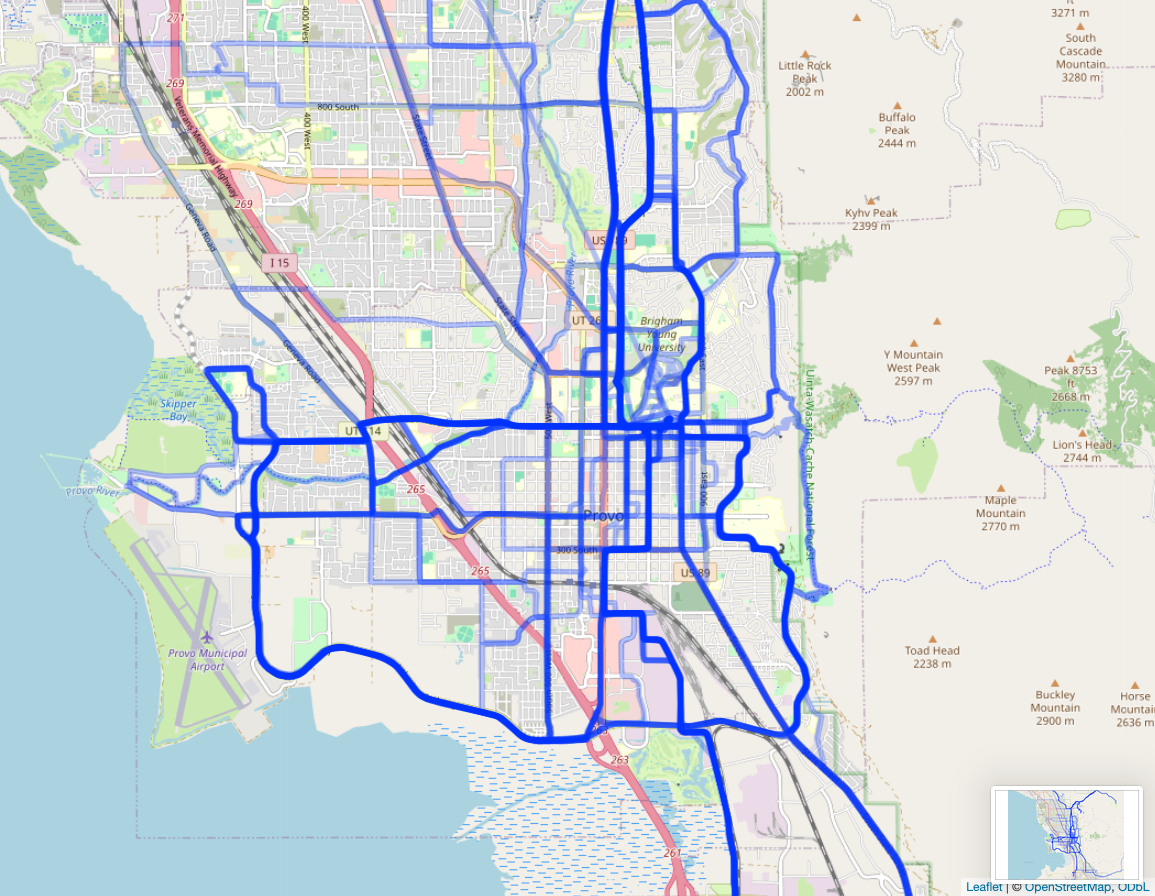
Runs
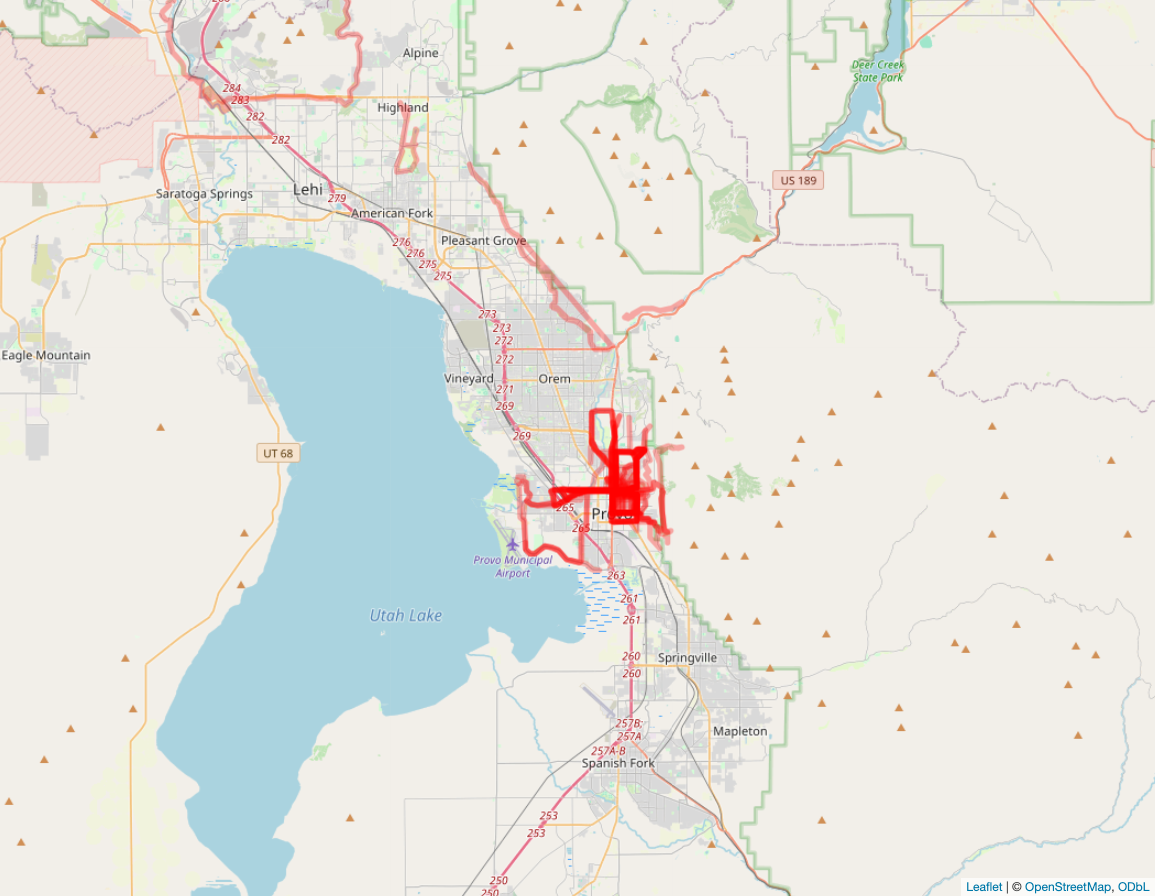
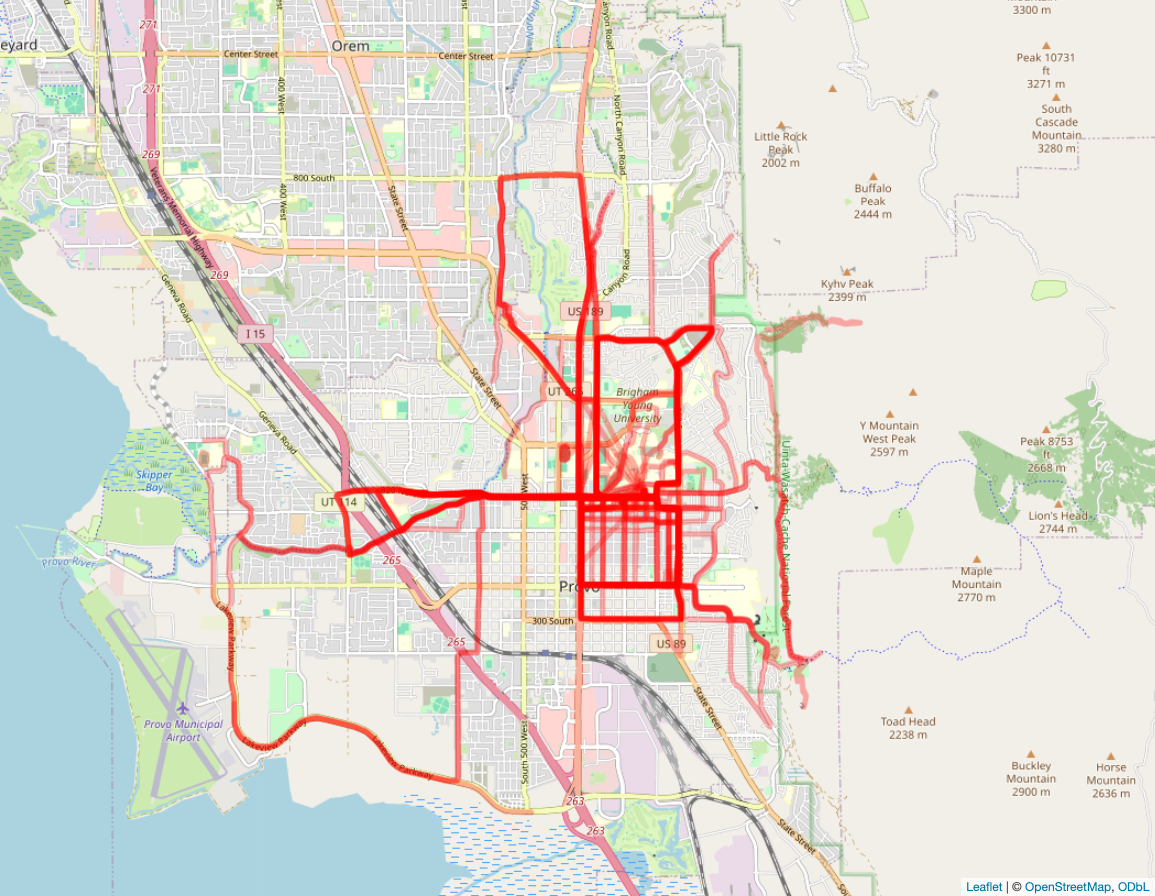
This is unsurprisingly packed more tighlty around Provo where I lived. University avenue, 800 North, 900 East, 300S, and Main Street east of University were all common spots. You can see a few longer runs that occured during marathon training cycles including segments along the Bonneville shoreline trail (on the first two red graphs), Lakeview Parkway, and even running down from Suncrest through Lehi (first running graph), which happened in the last month.